Python’s memory management often feels invisible — you create objects, use them, and they disappear when you’re done. But underneath that simplicity is a layered system involving reference counting, a cyclic garbage collector, and a memory allocator tuned specifically for Python’s object model. Understanding these layers helps you write more efficient code and debug memory leaks when they do occur.
For this article, I’ll focus on the memory management done by the default implementation of Python, CPython.
Table of Contents
Memory Model Overview
Python’s memory management involves:
- Object-specific memory management
- Private heap allocation
- Automatic garbage collection
- Reference counting
- Cyclic garbage detection
All memory management is automatic but controllable to some extent.
Everything in Python is an object
Everything in Python is an object. It’s a core design principle of Python. Every value you can name or manipulate — integers, strings, functions, classes, modules, even None — is an instance of some class, and every one of them has an identity, a type, and a value.
Primitive data type
x = 5
print(type(x))   # <class 'int'>

y = "backendmesh"
print(type(y))   # <class 'str'>

z = [1,2,3,4]
print(type(z)) #<class 'list'>Functions are objects too
def greet():
    return "hi"

print(type(greet))      # <class 'function'>
greet.custom_attr = 42  # you can attach an attribute to a function!
print(greet.custom_attr) # 42Classes themselves are objects (instances of type)
class Foo:
    pass

print(type(Foo))        # <class 'type'>
print(type(type)) # <class 'type'> — type is its own metaclassEven None, True, and int/str themselves are objects
print(type(None))   # <class 'NoneType'>
print(type(int)) # <class 'type'>Every Python Object Lives on the Heap
Integers, floats, strings, lists, dicts, tuples, class instances, functions — all of it is heap-allocated.
There’s no separate memory region reserved for variables the way people sometimes imagine. A variable name is not a box that holds a value directly — it’s a reference (a pointer) to wherever the actual object lives, and that object always lives on the heap.
x = 10Here, the integer object 10 is heap-allocated. x is a name that refers to it.
What a Function Call Actually Creates: The Frame
When you call a function, Python doesn’t just “run the code” — it first builds a frame: an internal structure that represents that specific call, in progress.
A frame holds:
- A reference to the compiled code being executed
- A fast-locals array — a slot-by-slot list holding a reference to each local variable
- A link back to the frame that made this call
- The current position in the bytecode (which instruction is executing right now)
def foo():
    x = 10
y = [1, 2, 3]When foo() runs, Python creates a frame for it. Inside that frame’s fast-locals array:
- Slot for x → reference to the integer object 10
- Slot for y → reference to the list object [1, 2, 3]
Both the slots themselves (inside the frame) and the objects they point to are heap-allocated. Reading x inside the function is a direct index into this array — that’s why local variable access in Python is fast, compared to looking a name up in a dictionary (which is what happens for global variables instead).
If your code calls locals() inside a function, Python builds an actual dictionary-like view of that fast-locals array on demand, only at that moment — it isn’t kept as a dictionary the whole time the function runs.
The Frame Chain
When one function calls another, each call gets its own frame, and each new frame keeps a link back to the frame that called it.
def a():
    b()

def b():
    c()

def c():
passCalling a() produces a chain:
frame for a → frame for b → frame for c.
Each frame stacks on top of the last, and each return removes the most recent one — last in, first out. That push/pop pattern is exactly why this chain is called “the call stack,” even though it’s really a linked chain of frame objects, not one dedicated block of memory set aside just for variables.
Common Mistake
Simple data(like primitive data types) in the stack, while complex data(like lists, sets, etc) in the heap
def foo():
    x = 10           # "data is in the stack as its simple integer"
y = [1, 2, 3] # "reference is in the stack, but data is in the heap"People often say x lives in the stack and y in the heap. This is not true for Python.
In Python, everything is an object, and objects live on the heap
So the honest picture is:
- The stack frame holds references (pointers), for both x and y — not values.
- The heap holds every actual object — the int object 10, the list object, and the three int objects inside it.
Garbage Collection
Everything Is an Object, and Objects Are Reference-Counted
In CPython (the standard Python implementation), every object carries a hidden counter tracking how many references point to it. This is called reference counting, and it’s the primary mechanism behind Python’s memory management.
import sys

a = []
print(sys.getrefcount(a))  # 2 (one from 'a', one from getrefcount's own argument)

b = a
print(sys.getrefcount(a))  # 3 (now 'b' also references the list)

del b
print(sys.getrefcount(a)) # back to 2Every time a reference is created — assigning a variable, appending to a list, passing an argument to a function — the count goes up. Every time a reference goes out of scope, gets reassigned, or is explicitly deleted, the count goes down. The moment an object’s reference count hits zero, CPython deallocates it immediately.
This immediacy is one of reference counting’s biggest strengths: memory is freed as soon as it’s no longer needed, rather than waiting for a garbage collector to run in the background. There’s no unpredictable pause where the interpreter stops the world to clean up — deallocation is deterministic and happens inline.
The Problem: Reference Cycles
Reference counting has one well-known blind spot: reference cycles. Consider two objects that reference each other:
class Node:
    def __init__(self):
        self.other = None

a = Node()
b = Node()
a.other = b
b.other = a

del a
del bAfter del a and del b, neither object is reachable from your code anymore — but each still holds a reference to the other. Their reference counts never drop to zero, so pure reference counting alone would leak this memory forever.
This is where Python’s second memory management layer comes in: the cyclic garbage collector.
The Cyclic Garbage Collector
Python’s gc module implements a generational garbage collector specifically designed to catch reference cycles that the reference-counting mechanism can’t handle on its own.
It works by periodically scanning container objects (lists, dicts, class instances, and anything else that can hold references to other objects) to detect groups of objects that reference each other but aren’t reachable from anywhere else in the program. When such an isolated cycle is found, the collector breaks it apart and frees the memory.
import gc

# Manually trigger a collection cycle
gc.collect()

# Check collection thresholds for each generation
print(gc.get_threshold())  # e.g. (700, 10, 10)

# Disable automatic collection (rarely a good idea, but possible)
gc.disable()Generational Collection
The garbage collector organises objects into three generations (0, 1, and 2) based on how long they’ve survived:
- Generation 0: newly created objects. Collected most frequently.
- Generation 1: objects that survived at least one generation-0 collection.
- Generation 2: long-lived objects that survived multiple collections.
Analogy: Think of it like three trays on a desk. Imagine three trays: Tray 0, Tray 1, Tray 2.
- New paperwork (new objects) always lands in Tray 0 first.
- Tray 0 gets checked very often (like, every few minutes) — most paperwork in there is junk you’re done with, so you throw it away.
- But if something in Tray 0 keeps surviving your junk-checks — it’s clearly not junk — you move it to Tray 1, so you stop re-checking it so often.
- Tray 1 gets checked less often (say, once an hour).
- If something in Tray 1 also keeps surviving those less-frequent checks, you move it to Tray 2 — the “this is definitely important, barely ever recheck it” tray.
- Tray 2 gets checked rarely (once a day).
- Once something is in Tray 2, there’s no Tray 3. It just stays in Tray 2 forever, getting rechecked occasionally, until one day it actually does become junk and gets thrown out.
The reasoning behind this design is the generational hypothesis: most objects die young. Temporary variables, loop counters, and short-lived intermediate results are created and discarded constantly, while a smaller set of objects (module-level constants, long-lived caches, core data structures) stick around for the life of the program. By scanning generation 0 far more often than generation 2, Python spends most of its garbage-collection effort where it actually finds garbage, rather than repeatedly re-scanning objects that are almost certainly still alive.
Thresholds
import gc
print(gc.get_threshold())
# (700, 10, 10)This returns three numbers — one per generation: (gen0_threshold, gen1_threshold, gen2_threshold).
- Gen 0 threshold (700 by default): This is a count of allocations minus deallocations. Every time you create a container object (list, dict, class instance, etc.), an internal counter goes up. Every time one gets freed, it goes down. Once that running total crosses 700, Python triggers a gen-0 collection. So it’s not “700 objects total” — it’s “the net amount of new stuff sitting around since the last check has crossed 700.”
- Gen 1 threshold (10 by default): This isn’t counting objects at all — it’s counting how many gen-0 collections have happened since the last gen-1 collection. Once 10 gen-0 collections have occurred, Python triggers a gen-1 collection (which also sweeps gen 0 again as part of that).
- Gen 2 threshold (10 by default): Same idea, one level up — once 10 gen-1 collections have happened since the last gen-2 collection, a gen-2 (full) collection runs.
Why Not Just Use the Cyclic Collector for Everything?
Reference counting handles the vast majority of deallocations cheaply and deterministically, without needing a scan of the whole object graph. The cyclic collector is comparatively expensive — it has to traverse container objects to find cycles — so it only needs to run periodically, and only needs to worry about container types capable of participating in a cycle. Scalar types like int and str never need to be considered by the cycle detector at all.
Reference Counting vs. Cyclic Collector
| Reference Counting | Cyclic Collector | |
|---|---|---|
| What it catches | Objects with zero references | Objects stuck in reference cycles (unreachable but refcount > 0) |
| When it runs | Immediately, the instant a refcount hits 0 | Periodically, on its own schedule |
| How it decides what to check | Simple counter per object — no scanning needed | Uses the generational strategy (gen 0/1/2 trays) to decide what to scan |
| Cost | Cheap — just incrementing/decrementing a number | More expensive — has to walk through objects and their references |
| Can you turn it off? | No — it’s fundamental to how CPython works | Yes — gc.disable() |
Python's Memory Management
│
├── 1. Reference Counting  ← handles 90%+ of cases, instantly, no scanning
│
└── 2. Cyclic Collector    ← handles the leftover problem (cycles)
        └── uses Generational Collection as ITS internal strategy
              (gen 0, gen 1, gen 2 — decides what/how often to scan)
Python Memory Architecture
There are layers of abstraction from the physical hardware to CPython. The operating system (OS) abstracts the physical memory and creates a virtual memory layer that applications (including Python) can access.
An OS-specific virtual memory manager carves out a chunk of memory for the Python process. The darker grey boxes in the image below are now owned by the Python process.
Python uses a portion of the memory for internal use and non-object memory. The other portion is dedicated to object storage (your int, dict, and the like).
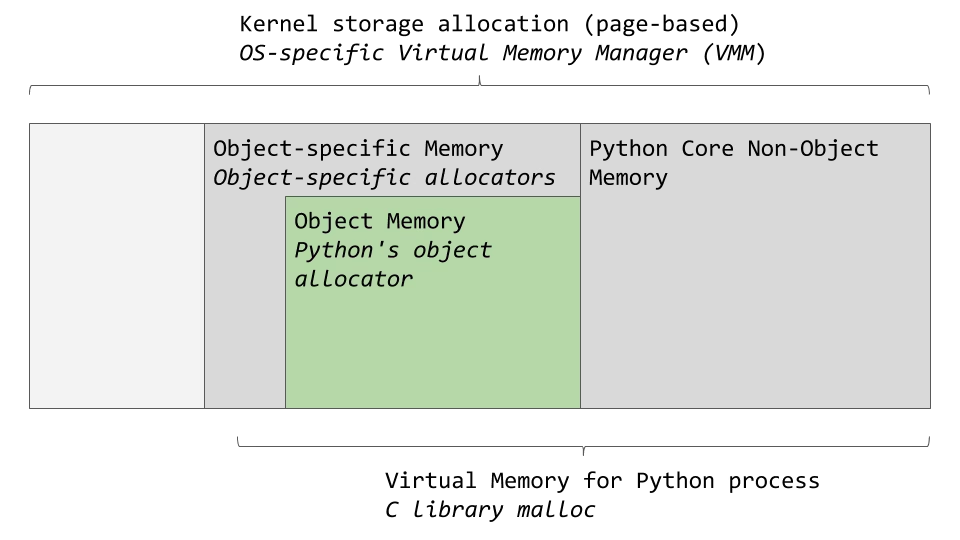
CPython has an object allocator that is responsible for allocating memory within the object memory area. This object allocator is where most of the magic happens. It gets called every time a new object needs space allocated or deleted.
Typically, the addition and removal of data for Python objects, such as lists and integers, doesn’t involve too much data at a time. So the design of the allocator is tuned to work well with small amounts of data at a time. It also tries not to allocate memory until it’s absolutely required.
Now we’ll look at CPython’s memory allocation strategy. First, we’ll talk about the 3 main pieces and how they relate to each other.
Python memory is divided into:
- Blocks: Smallest unit (used for objects < 512 bytes)
- Pools: Group of blocks of the same size
- Arenas: Group of pools (256 KB each)
Memory Allocation Internals
pymalloc
- Python has a custom allocator for small objects (< 512 bytes)
- Avoids OS malloc() for performance reasons
- Objects of similar sizes are grouped in pools (4096 bytes)
Larger objects (> 512 bytes)
- Allocated using standard malloc() via the OS
Memory Optimisation Techniques in Python
Interning
Python “interns” commonly-used immutable objects to save memory.
a = 10
b = 10
print(id(a) == id(b))  # True (same memory)

x = "hello"
y = "hello"
print(id(x) == id(y))  # True
Use of Generators
Avoid building large lists in memory:
# Memory inefficient
squares = [x**2 for x in range(10**6)]

# Memory efficient
squares_gen = (x**2 for x in range(10**6))slots
In custom classes, avoid the dynamic __dict__ overhead:
class Person:
__slots__ = ['name', 'age'] # Reduces memory usageTools for Memory Monitoring
sys.getsizeof()
Get size of a Python object in bytes.
import sys
print(sys.getsizeof(123)) # 28 bytestracemalloc
Track memory allocations over time.
import tracemalloc

tracemalloc.start()
# Your code
snapshot = tracemalloc.take_snapshot()
for stat in snapshot.statistics('lineno')[:10]:
print(stat)memory_profiler
Line-by-line memory usage in Python.
Install
pip install memory_profilerExample
from memory_profiler import profile

@profile
def my_func():
...Execution
python -m memory_profiler your_script.pyConclusion
Understanding Python’s memory management system is key for writing efficient and optimised code. By comprehending how reference counting works, how the garbage collector handles cyclic references, and the memory allocation strategies employed by Python, we can avoid common issues and improve the performance of our applications.
